
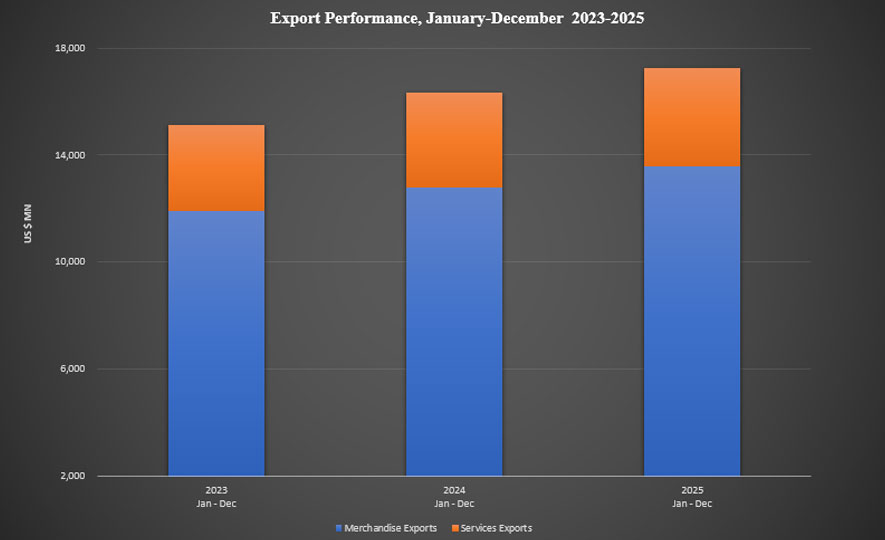
Sri Lanka’s export sector continued its positive growth momentum in 2025, recording a notable y-o-y growth of 5.6 %. Based on Sri Lanka Customs statistics and estimated export figures for Gems and Jewellery, Petroleum Products, and services, total export earnings reached US$ 17,252.15 Mn in 2025, reflecting sustained growth and improving external trade conditions.
In December 2025, total exports, comprising both merchandise and services amounted to US$1,490.49 Mn, representing a 3.95 % y-o-y increase. This performance underscores the resilience of Sri Lanka’s export sector and the effectiveness of policy measures and strategic interventions aimed at expanding market access and strengthening global competitiveness.
Commenting on this achievement, Mr. Mangala Wijesinghe, Chairman and CEO of the Export Development Board (EDB), highlighted that Sri Lanka achieved 94.79% of its annual export target, driven by the recovery of key markets, sustained production capacity, and effective export development strategies.
Merchandise and Services Exports
Merchandise exports in December 2025 recorded a 5.88% y‑o‑y increase, reaching US$ 1,166.60 million. For the full year, merchandise exports totaled US$ 13,579.38 million, reflecting a 6.32% increase compared to 2024.
During December 2025, services export earnings are estimated to have declined by 2.47 %, reaching US$ 323.89 Mn. However, on an annual basis, services exports recorded an estimated 2.79 % growth in 2025, totaling US$ 3,672.77 Mn. This performance underscores the growing significance of Sri Lanka’s knowledge-based economy and its increasing contribution to national export earnings.
The services export sector, encompassing ICT/BPM, Construction, Financial Services, and Transport and Logistics, continues to play a vital role in diversifying Sri Lanka’s export base while generating high-value employment opportunities across the country.
Major Exports in December 2025
Products and Services with Positive Growth (Increases)
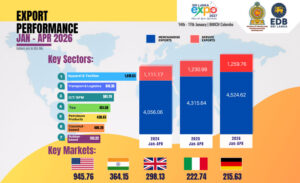
• Apparel & Textiles: Earnings rose 5.26% y‑o‑y to US$ 470.35 million.
• Coconut‑based products: Recorded a remarkable 27.24% increase, with Coconut Oil (+54.26%), Coconut Cream (+97.61%), and Liquid Coconut Milk (+31.23%) showing strong demand.
• Activated Carbon: Export earnings increased by 34.53% to US$ 19.52 million.
• Food & Beverages: Grew 17.28% y‑o‑y to US$ 48.67 million, driven by processed food exports (+12.04%).
• Diamonds, Gems & Jewellery: Surged 46.15% to US$ 23.91 million.
• Seafood: Increased 16.09% y‑o‑y to US$ 23.38 million, supported by strong fresh fish exports (+30.96%).
• ICT/BPM: Earnings rose 5.19% to US$ 169.83 million.
Products with Negative Growth
• Tea: Declined 19.59% to US$ 105.82 million, mainly due to weaker bulk tea and packet sales.
• Electrical & Electronics Components: Dropped 11.09% to US$ 35.20 million.
• Spices & Essential Oils: Fell 6.23% to US$ 44.22 million, largely due to a sharp decline in pepper exports to India.
• Ornamental Fish: Earnings decreased 9.05% to US$ 1.81 million.
Annual Export Performance (January – December 2025)
Cumulative exports for 2025 reached US$ 17,252.15 million, marking a 5.6% increase compared to 2024. Merchandise exports grew 6.32% to US$ 13,579.38 million, while services exports rose 2.79% to US$ 3,672.77 million.
Key Growth Drivers
• Apparel & Textiles: Increased 5.34% to US$ 4,909.05 million, with strong demand from the EU (+12.2%), US, and UK.
• Tea: Recorded earnings of US$ 1,507.19 million, up 4.97%, driven by packet tea (+10.18%).
• Coconut Products: Surged 42.66% to US$ 1,233.01 million, with Coconut Cream (+93.16%) and Coconut Oil (+78.68%) leading growth.
• Food & Beverages: Rose 24.23% to US$ 583.89 million, supported by processed food exports (+40.4%).
• Seafood: Increased 3.09% to US$ 240.19 million, driven by frozen fish (+16.64%).
• Electrical & Electronic Components: Grew 3.91% to US$ 438.49 million, supported by insulated wires (+7.38%) and transformers (+12.95%).
• ICT/BPM: Expanded 8.81% to US$ 1,644.83 million.
• Logistics & Transport Services: Increased 3.22% to US$ 1,851.58 million.
Sectors with Declines
• Rubber & Rubber Products: Fell 5.56% to US$ 945.73 million, mainly due to weaker tyre exports.
• Spices & Essential Oils: Declined 2.59% to US$ 449.9 million, with pepper exports down 39.68%.
• Ornamental Fish: Dropped 7.6% to US$ 22.6 million.
Export Destinations and Market Trends
Sri Lanka’s top export destinations showed resilience in 2025. The United States, accounting for 23% of merchandise exports, grew 5.96% in December to US$ 264.91 million, and 3.06% annually to US$ 2,999.15 million.
India emerged as the second‑largest destination, with exports increasing 17.21% to US$ 1,035.72 million in 2025, despite a 7.35% decline in December.
Exports to the United Kingdom rose 6.57% in December to US$ 74.01 million, and 2.8% annually to US$ 929.03 million. Other key markets such as Germany, Italy, the Netherlands, and China also recorded positive growth, reinforcing Sri Lanka’s diversified export footprint.
Conclusion
Sri Lanka’s export sector demonstrated resilience and adaptability in 2025, achieving over US$ 17.2 billion in earnings despite global challenges. The strong performance of apparel, coconut products, ICT/BPM, and food & beverages highlights the country’s ability to leverage both traditional strengths and emerging industries.
While certain sectors such as tea, rubber, and spices faced headwinds, the overall growth trajectory reflects effective policy interventions, market diversification, and value‑addition strategies. With continued focus on innovation, sustainability, and global competitiveness, Sri Lanka is well‑positioned to strengthen its role in international trade in the years ahead.